How to visualise a Kedro project
This section assumes you are familiar with the basic Kedro concepts described in the spaceflights tutorial. If you have not yet worked through the tutorial, you can still follow this example.
If you haven’t installed Kedro follow the documentation to get set up.
Important
We recommend that you use the same version of Kedro that was most recently used to test this tutorial (0.19.0). To check the version installed, type kedro -V in your terminal window.
In your terminal window, navigate to the folder you want to store the project. Generate the spaceflights tutorial project with all the code in place by using the Kedro starter for the spaceflights tutorial:
kedro new --starter=spaceflights-pandas
When prompted for a project name, you can enter anything, but we will assume Spaceflights throughout.
When your project is ready, navigate to the root directory of the project and install the dependencies for the project, which include Kedro-Viz:
pip install -r src/requirements.txt
The next step is optional, but useful to check that all is working. Run the full set of pipelines for the tutorial project:
kedro run
To start Kedro-Viz, type the following into your terminal from the project directory:
kedro viz run
Important
The former kedro viz command used here is now deprecated with the release of Kedro-Viz 7.0.0.
kedro viz run is now the new way to run the tool.
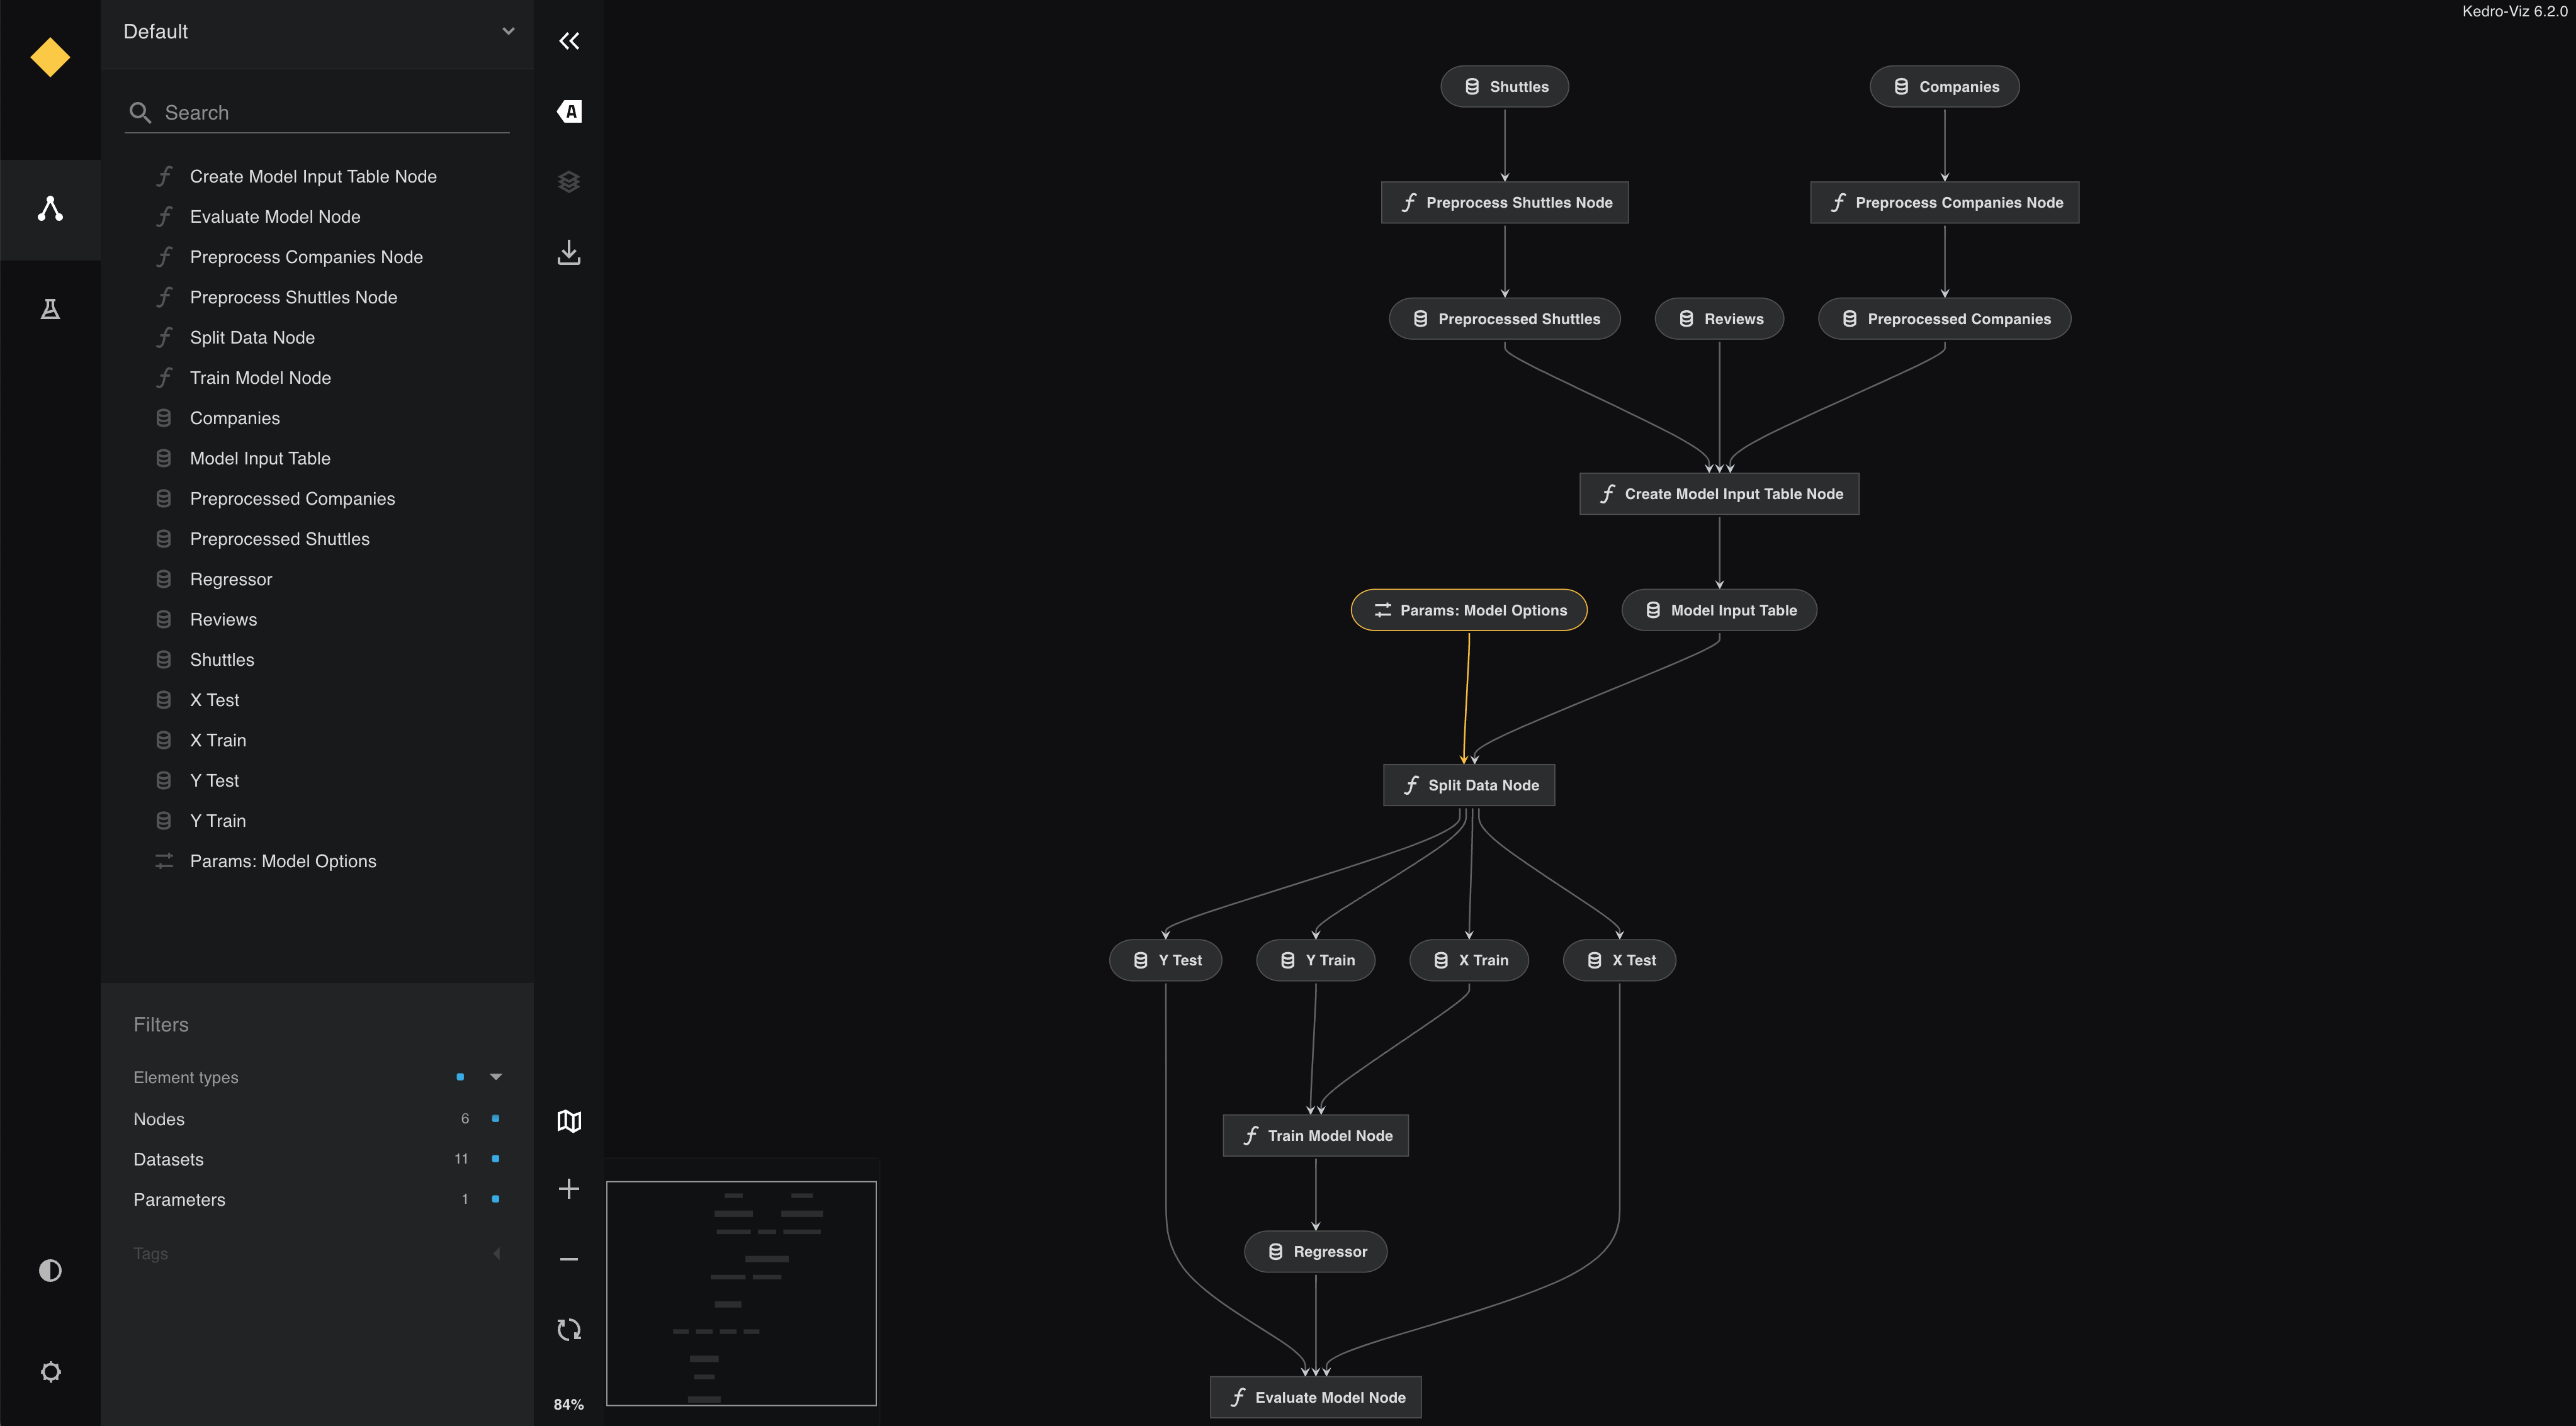
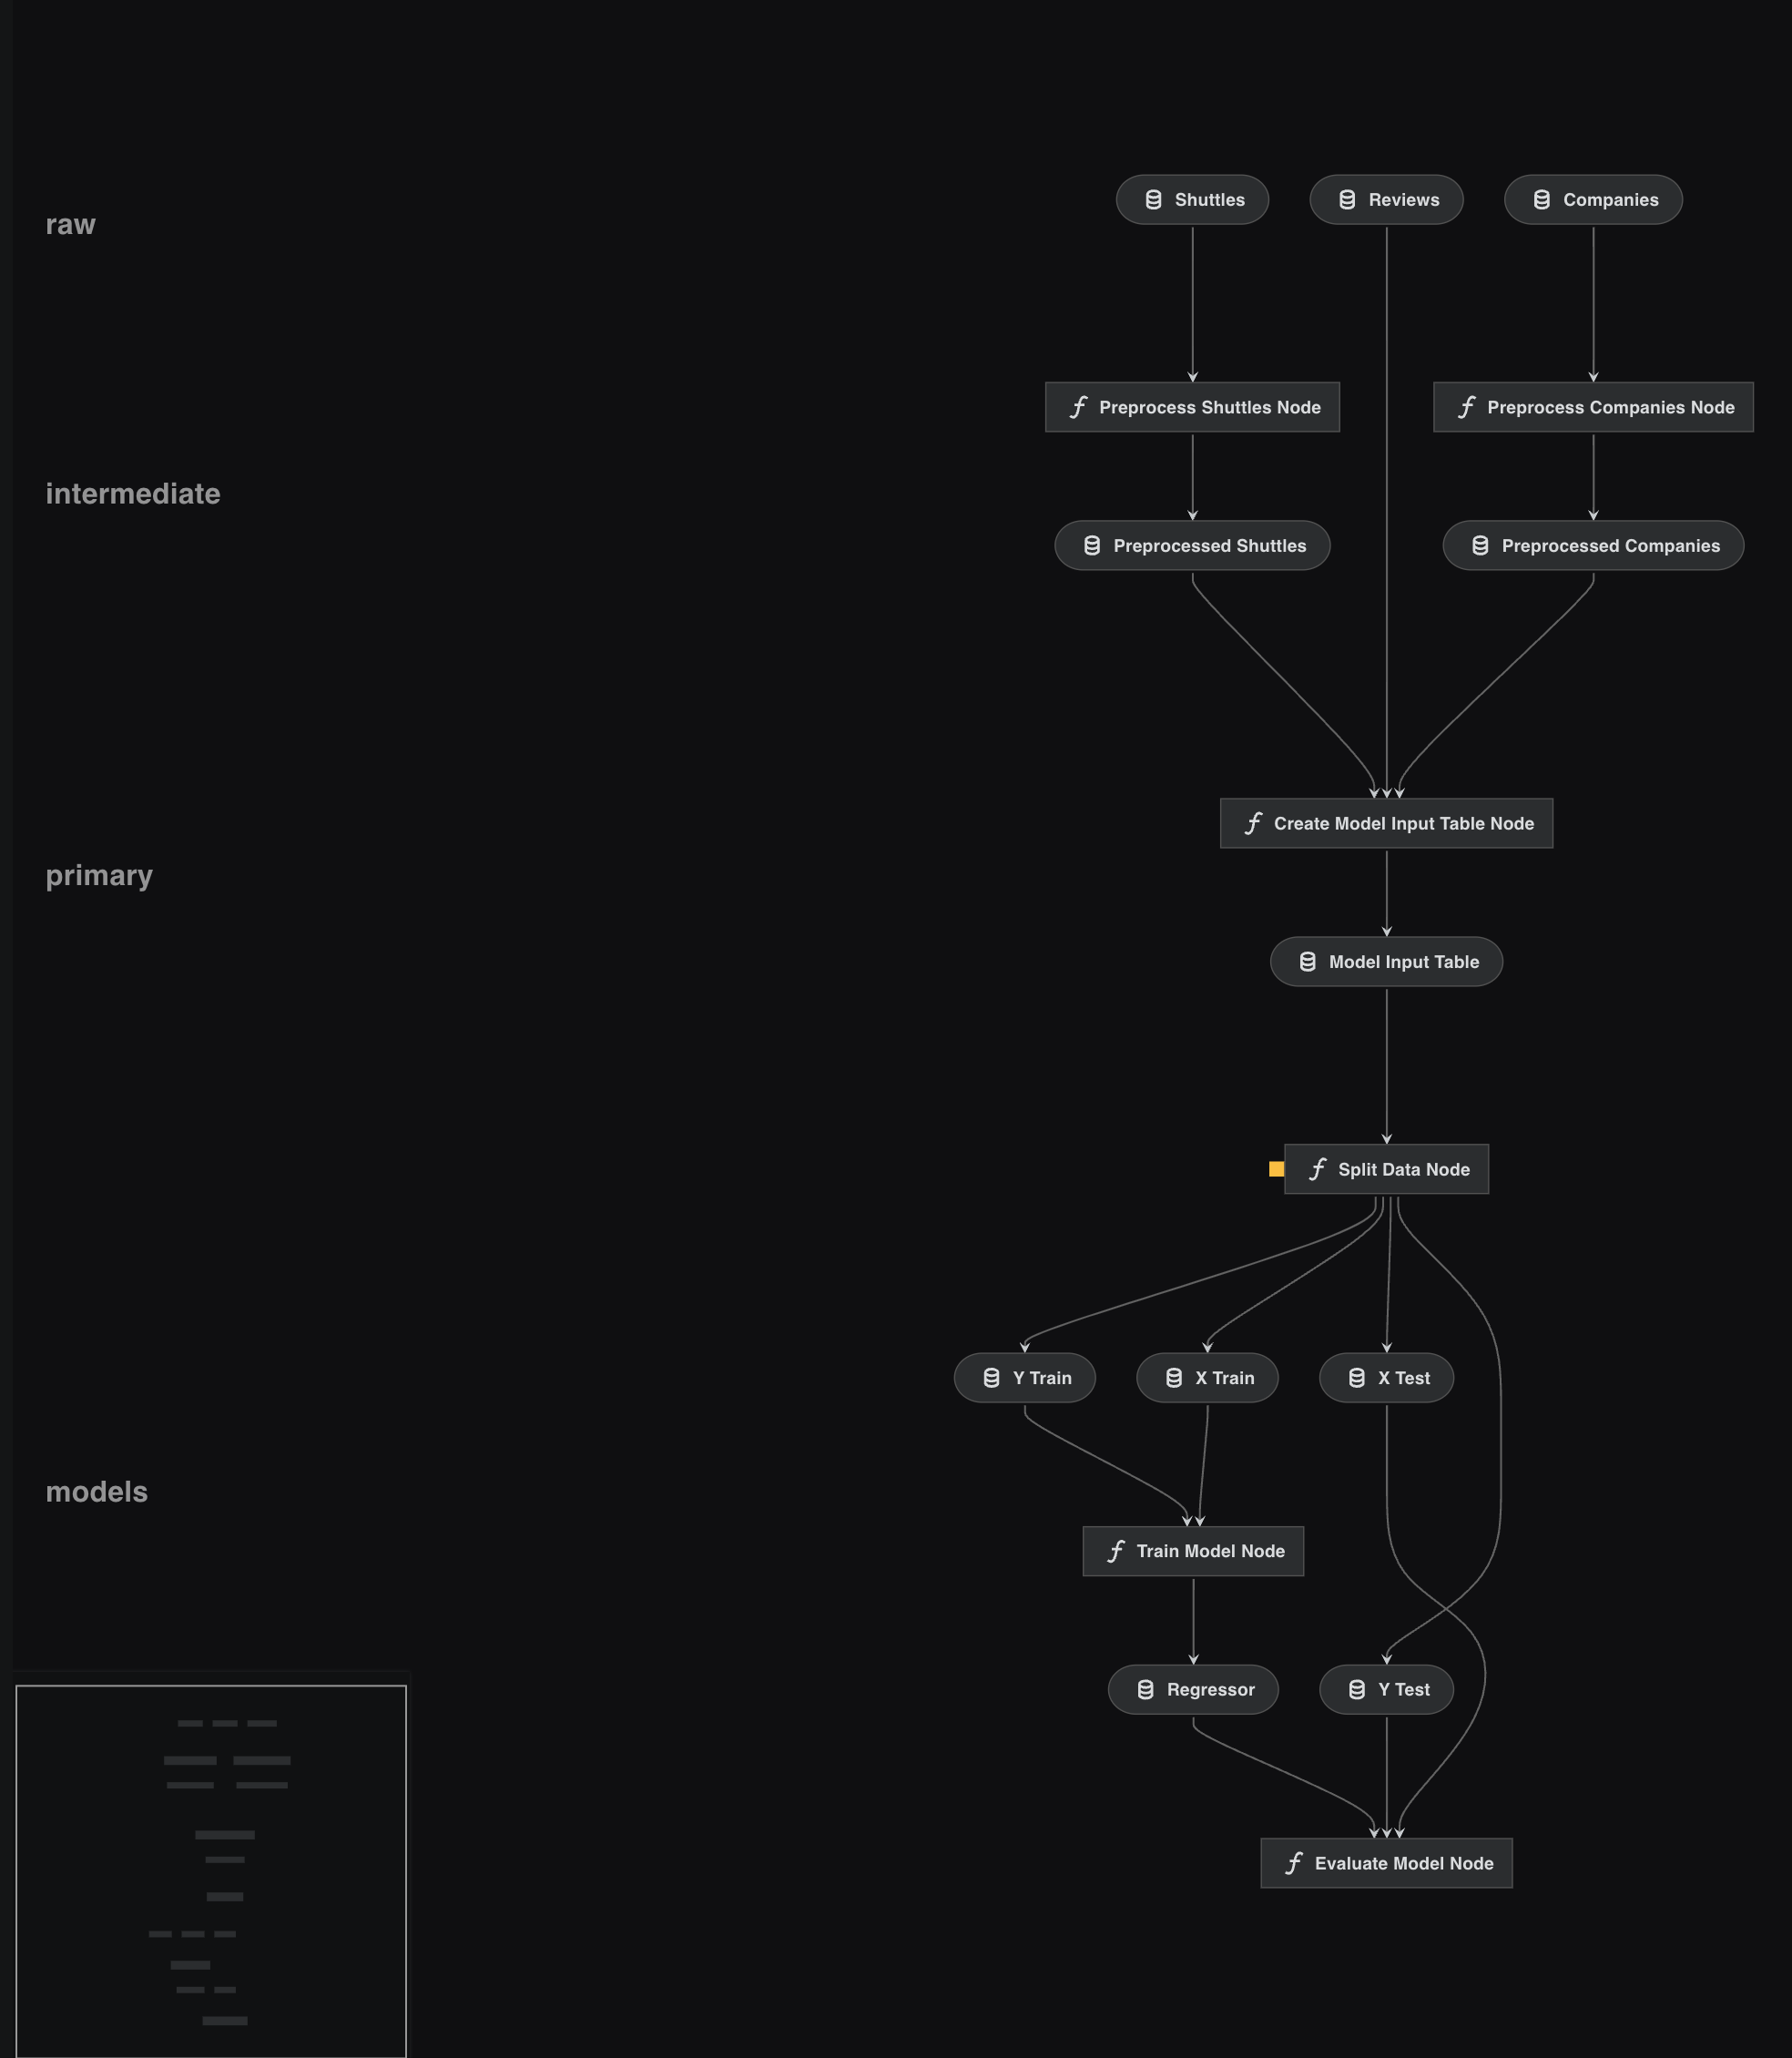
The command opens a browser tab to serve the visualisation at http://127.0.0.1:4141/.
You should see the following:
If a visualisation panel opens up and a pipeline is not visible, refresh the view. If you still don’t see the visualisation, the Kedro community can help:
use the #questions channel on our Slack channel to ask the community for help
search the online archive of Slack discussions
To exit the visualisation, close the browser tab. To regain control of the terminal, enter ^+c on Mac or Ctrl+c on Windows or Linux machines.
Automatic visualisation updates
You can use the --autoreload flag to autoreload Kedro-Viz when a Python or YAML file changes in the project. Add the flag to the command you use to start Kedro-Viz:
kedro viz run --autoreload
The autoreload flag reflects changes to the project as they happen. For example, commenting out create_model_input_table_node in pipeline.py will trigger a re-render of the pipeline:
Visualise layers
By convention, a pipeline can be defined as having different layers according to how data is processed.
For example, the data engineering convention labels datasets according to the stage of the pipeline (e.g. whether the data has been cleaned).
In Kedro version 0.18.9 we changed the way layers are defined in the Data Catalog. The definition is now included under the metadata key for kedro-viz (previously it was an attribute specified within a dataset’s definition).
Here’s an example of how to use the Kedro-Viz metadata to define layers:
companies:
  type: pandas.CSVDataset
  filepath: data/01_raw/companies.csv
  metadata:
    kedro-viz:
      layer: raw
In earlier versions of Kedro, layers were specified within a dataset’s definition in the Data Catalog, but this will no longer be supported from Kedro version 0.19.0. From that version onwards, your catalog.yml must specify layers as metadata.
companies:
  type: pandas.CSVDataset
  filepath: data/01_raw/companies.csv
-  layer: raw
+   metadata:
+     kedro-viz:
+       layer: raw
Open catalog.yml for the completed spaceflights tutorial and define layers in the following way:
companies:
  type: pandas.CSVDataset
  filepath: data/01_raw/companies.csv
  metadata:
    kedro-viz:
      layer: raw

reviews:
  type: pandas.CSVDataset
  filepath: data/01_raw/reviews.csv
  metadata:
    kedro-viz:
      layer: raw

shuttles:
  type: pandas.ExcelDataset
  filepath: data/01_raw/shuttles.xlsx
  metadata:
    kedro-viz:
      layer: raw

preprocessed_companies:
  type: pandas.ParquetDataset
  filepath: data/02_intermediate/preprocessed_companies.pq
  metadata:
    kedro-viz:
      layer: intermediate

preprocessed_shuttles:
  type: pandas.ParquetDataset
  filepath: data/02_intermediate/preprocessed_shuttles.pq
  metadata:
    kedro-viz:
      layer: intermediate

model_input_table:
  type: pandas.ParquetDataset
  filepath: data/03_primary/model_input_table.pq
  metadata:
    kedro-viz:
      layer: primary

regressor:
  type: pickle.PickleDataset
  filepath: data/06_models/regressor.pickle
  versioned: true
  metadata:
    kedro-viz:
      layer: models
The visualisation now includes the layers:
Running Kedro-viz in a notebook.
Follow the Jupyter notebook for Kedro project guide on how to use a Jupyter notebook to explore elements of a Kedro project. It shows how to use kedro jupyter notebook to set up a notebook that has access to the catalog, context, pipelines and session variables of the Kedro project, so you can query them.
Once you have followed the steps to set up your notebook. You can use line magic to display a Kedro-Viz visualisation of your pipeline directly in your notebook.
%run_viz line magic
Note
If you have not yet installed Kedro-Viz for the project, run pip install kedro-viz in your terminal from within the project directory.
The %run_viz line magic allows you to display an interactive visualisation of your pipeline directly in a new tab within your Jupyter notebook. You can also pass optional arguments to customise the visualisation environment, similar to how you would use the Kedro Viz command-line interface.
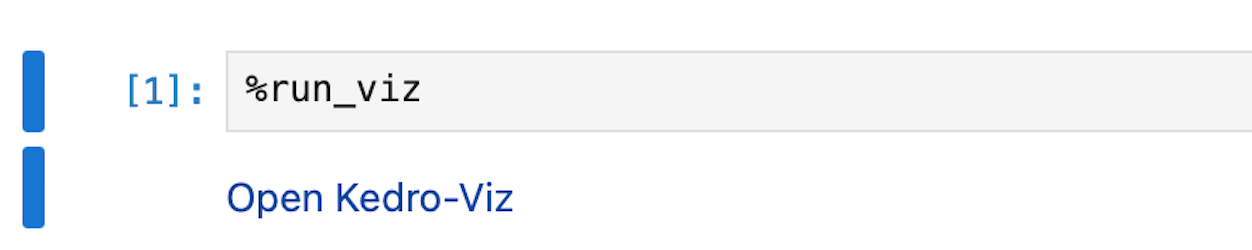
To use the %run_viz line magic without any arguments, simply run:
%run_viz
Optional Arguments
The %run_viz command supports various optional arguments found in kedro viz run:
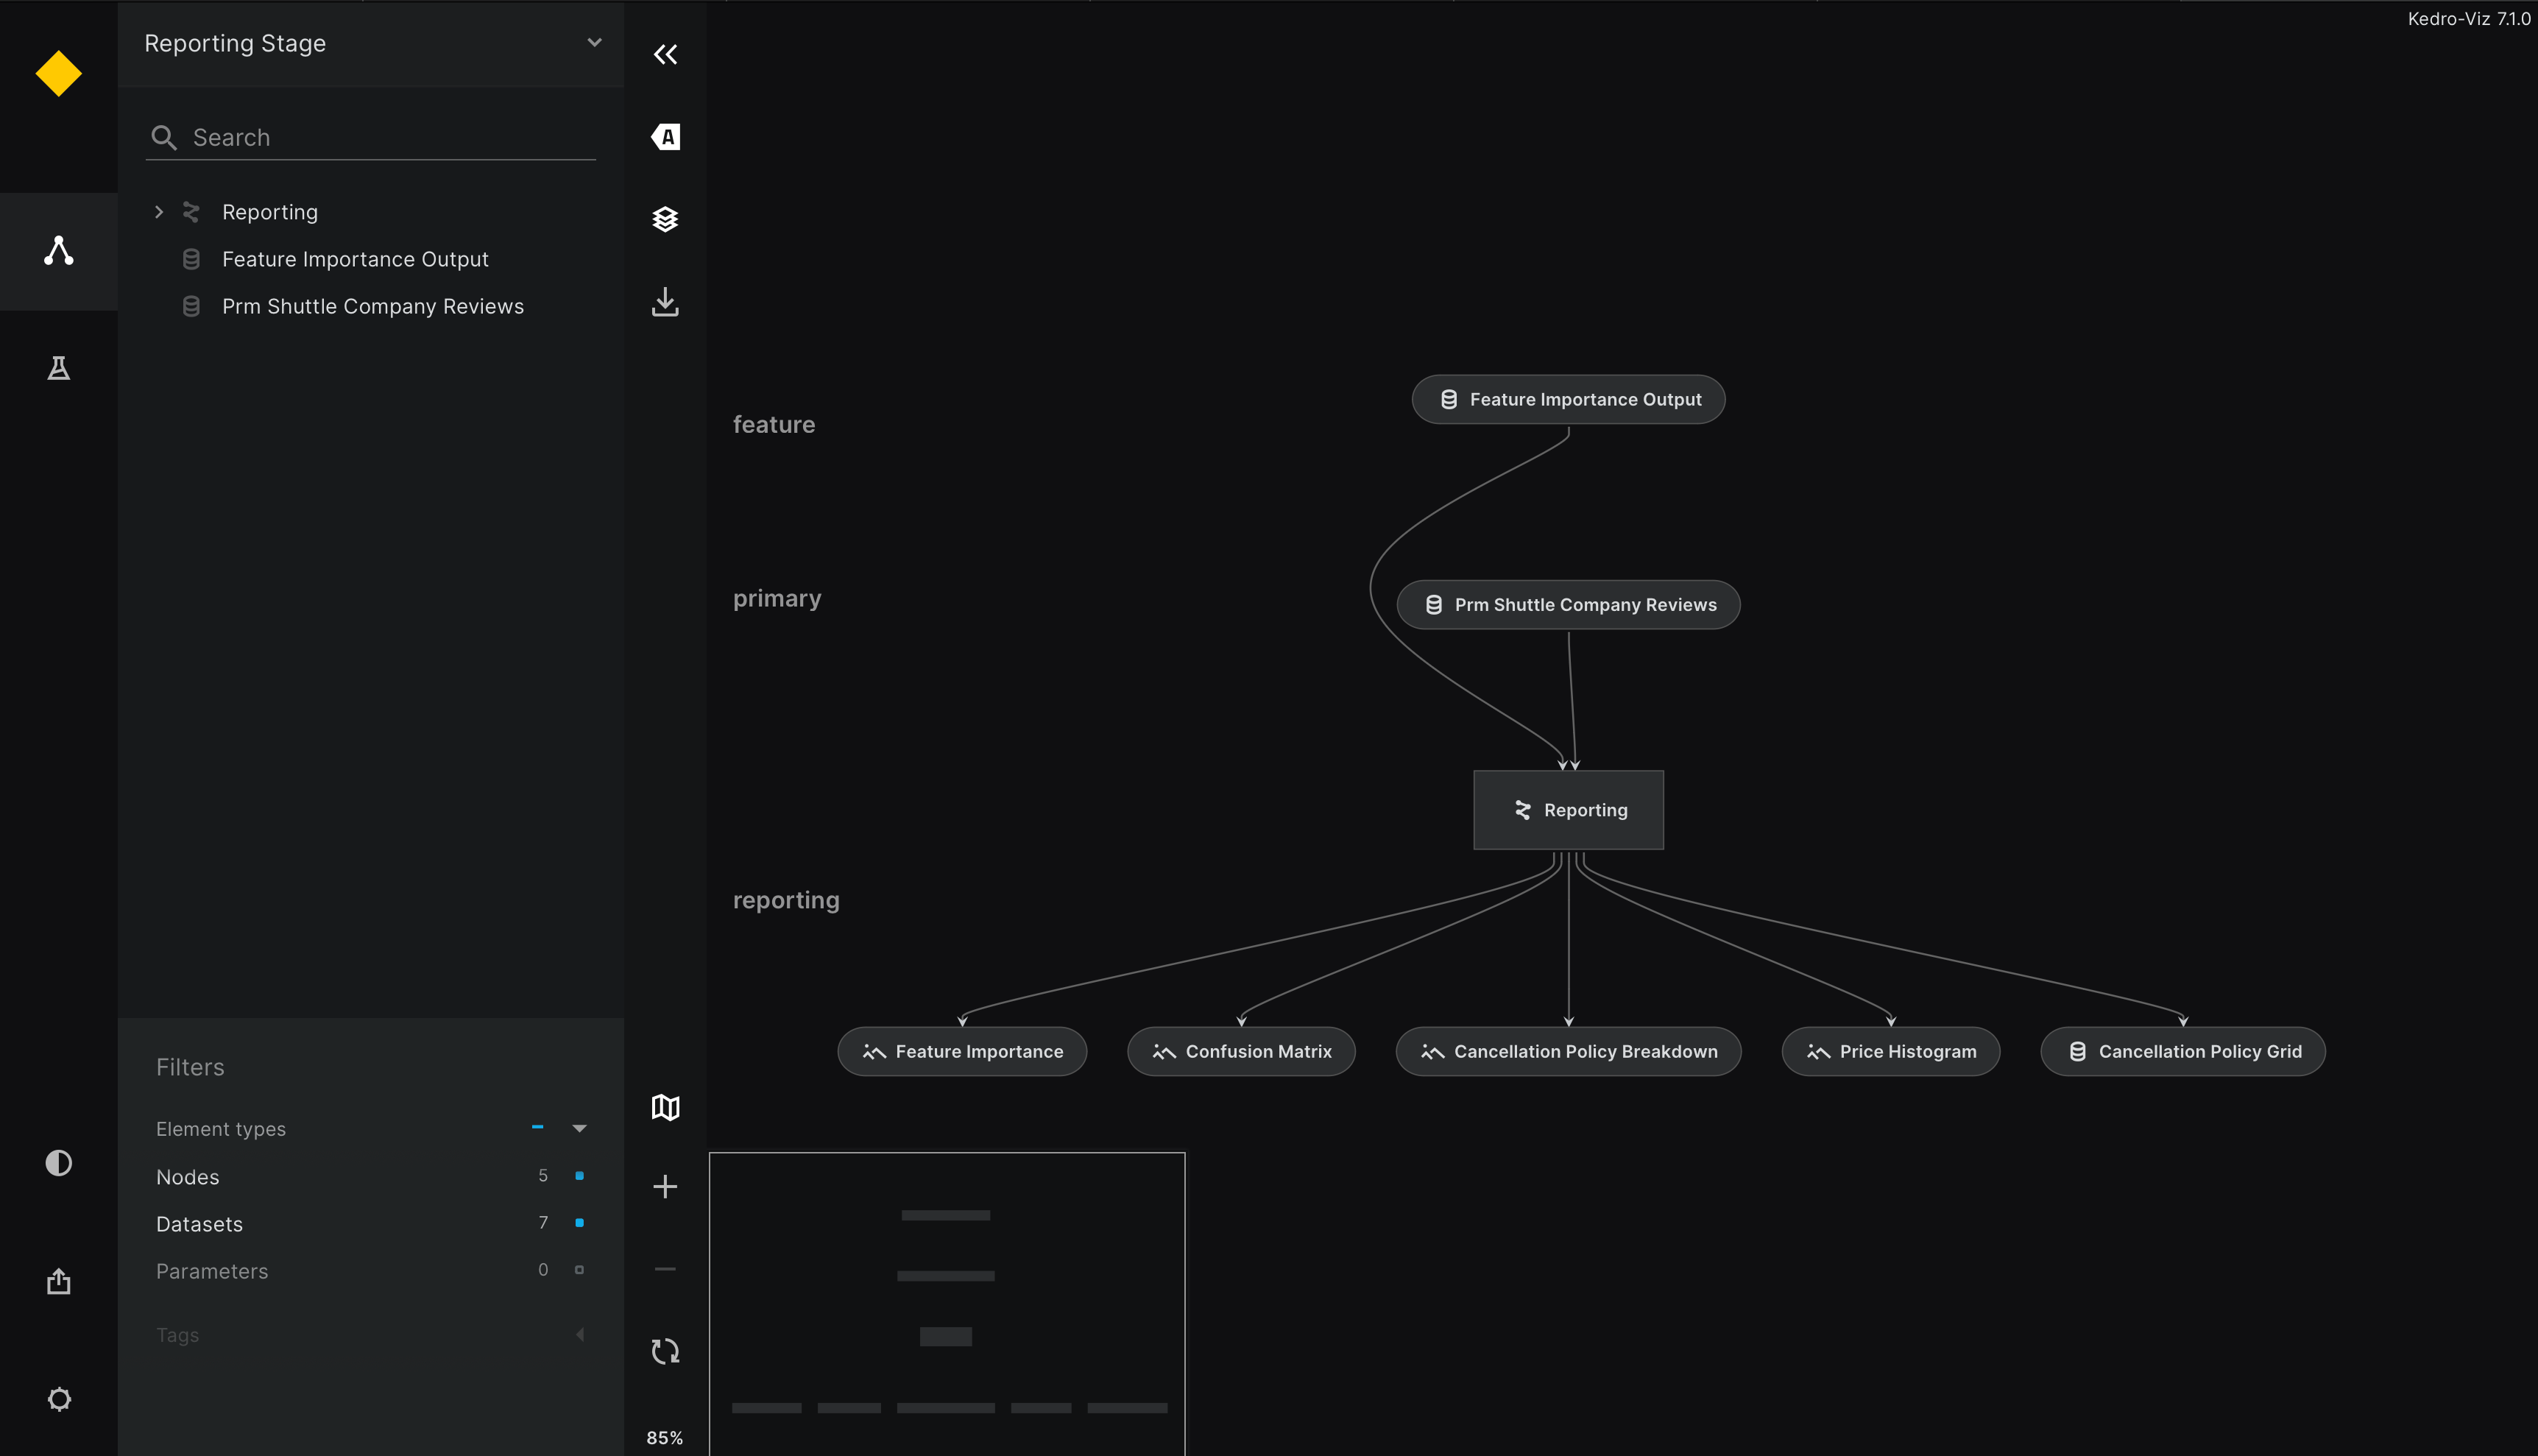
--host=<host>: Specify the server host.--port=<port>: Set the server port.--load-file=<file>: Load a specific pipeline visualisation file.--save-file=<file>: Save the current pipeline visualisation to a file.--pipeline=<name>: Visualise a specific pipeline.--env=<name>: Set the environment for the visualisation.--autoreload: Enable automatic reloading of the visualisation when source code changes.--ignore-plugins: Ignore Kedro plugins when running the visualisation.--params=<params>: Pass additional parameters to the visualisation.
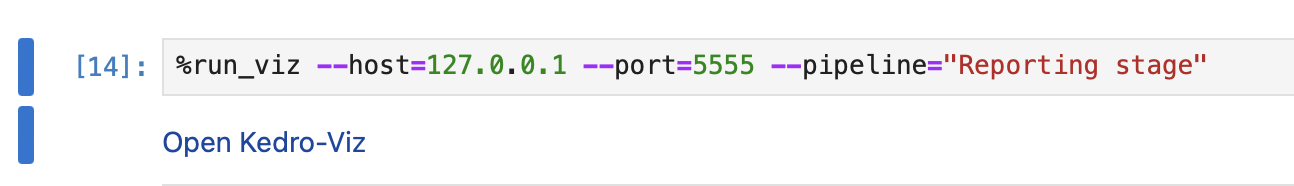
For example, to launch Kedro Viz on a specific host and port with autoreload enabled you can run:
%run_viz --host=127.0.0.1 --port=4141 --autoreload