
Set up Visual Studio Code
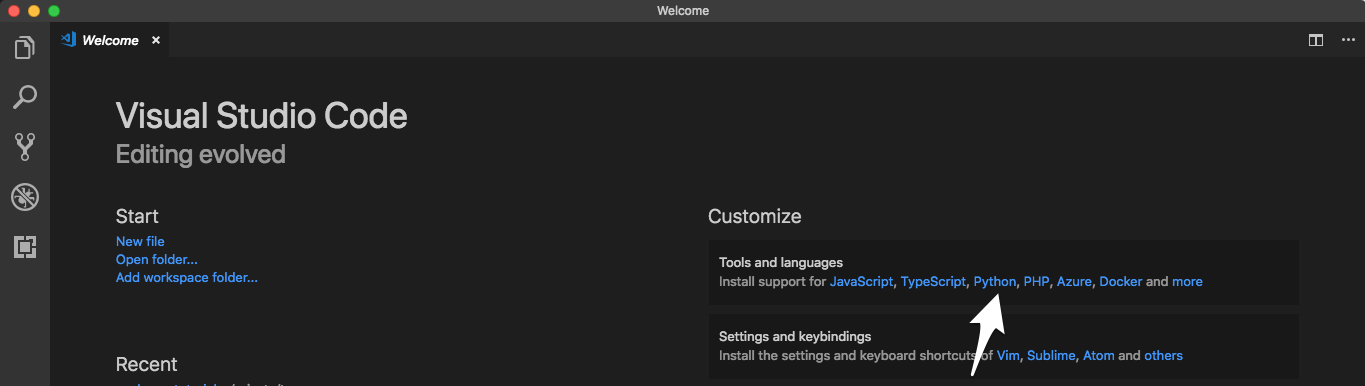
Start by opening a new project directory in VS Code and installing the Python plugin under Tools and languages:
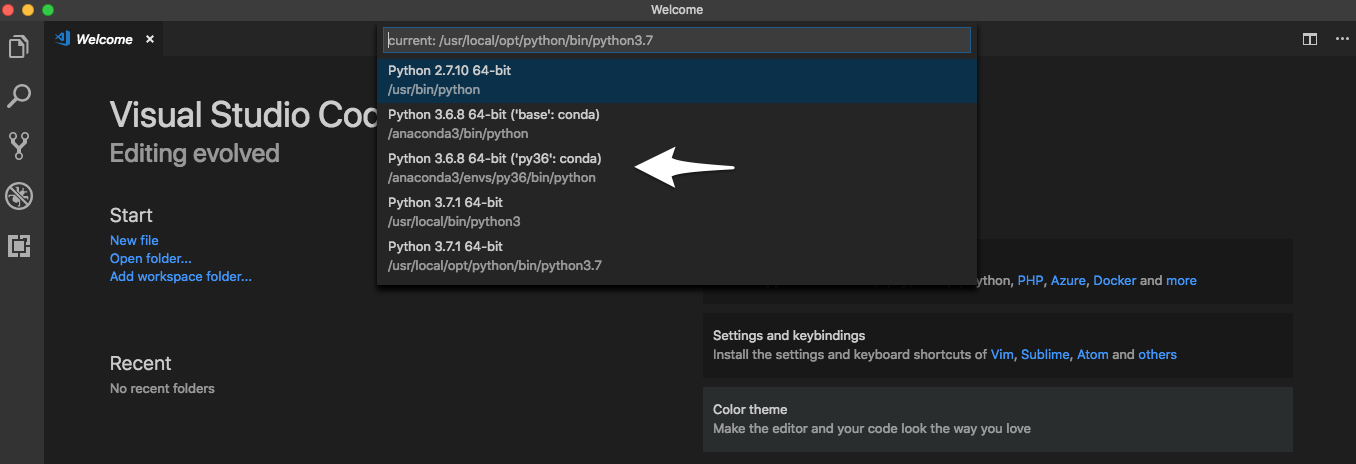
Python is an interpreted language; to run Python code you must tell VS Code which interpreter to use. From within VS Code, select a Python 3 interpreter by opening the Command Palette (Cmd + Shift + P for macOS), start typing the Python: Select Interpreter command to search, then select the command.
At this stage, you should be able to see the conda environment that you have created. Select the environment:
Advanced: For those using venv / virtualenv
We’re going to show you how to get your virtual environments to show up in your Python interpreter in VS Code. You do this by opening settings.json and adding the following:
"python.venvPath": "/path/containing/your/venvs/"
It is useful to note that if you create a venv / virtualenv in your project directory named venv, VS Code (much like PyCharm) automatically loads it as the Python interpreter (unless you manually define your Python interpreter to something else as described above).
Setting up tasks
Here we will show you how to setup tasks for such Kedro CLI commands as run, test, install, package, etc.
You’ll start by finding the path of your Kedro CLI script in the terminal:
# macOS / Linux
which kedro

# Windows (in **Anaconda Command Prompt**)
python -c 'import sys, os.path; print(os.path.join(os.path.dirname(sys.executable), "kedro"))'
We’re going to need you to modify your tasks.json. To do this, go to Terminal > Configure Tasks… on your menu and open up tasks.json in the editor. Modify it with the following:
{
    // See https://go.microsoft.com/fwlink/?LinkId=733558
    // Kedro tasks
    "version": "2.0.0",
    "tasks": [
        {
            "label": "Install",
            "type": "shell",
            "command": "/path/to/kedro/script",
            "args": [
                "install"
            ]
        },
        {
            "label": "Test",
            "group": "test",
            "type": "shell",
            "command": "/path/to/kedro/script",
            "args": [
                "test"
            ]
        },
        {
            "label": "Run",
            "type": "shell",
            "command": "/path/to/kedro/script",
            "args": [
                "run"
            ]
        },

        // This is the default build task
        {
            "label": "Package",
            "group": {
                "kind": "build",
                "isDefault": true
            },
            "type": "shell",
            "command": "/path/to/kedro/script",
            "args": [
                "package"
            ],
            // Will run `Test` before packaging
            "dependsOn": [
                "Test"
            ]
        }
    ]
}
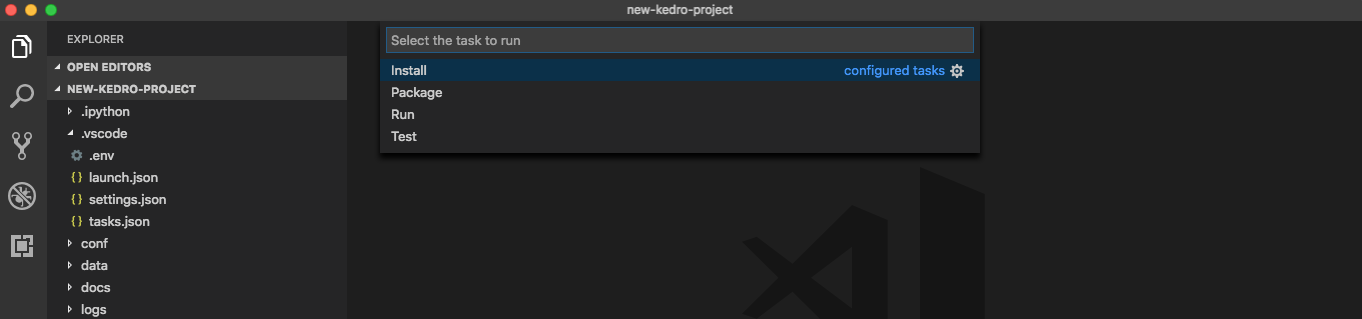
To start a build, go to Terminal > Run Build Task… or press Cmd + Shift + B for macOS. You can run other tasks by going to Terminal > Run and choosing which task you want to run.
Debugging
To debug, you may need to create an .env file in your project root. Add the full path to the ./src/ folder to the PYTHONPATH environment variable in the .env file:
# In macOS / Linux:
PYTHONPATH=/path/to/project/src:$PYTHONPATH

# In Windows
PYTHONPATH=C:/path/to/project/src;%PYTHONPATH%
You can find more information about setting up environmental variables in the VSCode documentation.
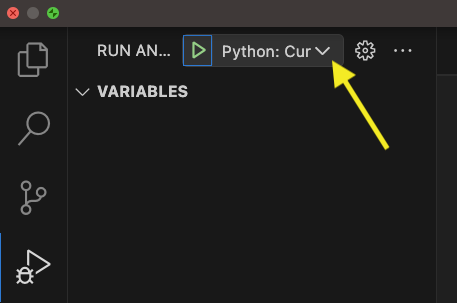
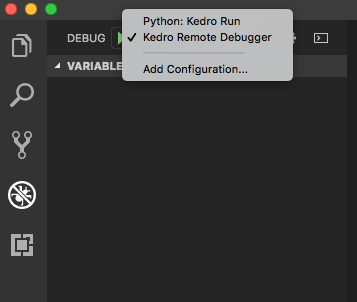
Click on the Run and Debug icon on the left activity bar (press Cmd + Shift + D for macOS). If there is no existing configuration, click on create a launch.json file else click on the dropdown arrow in the top-left (shown below) and click Add Configuration .
Note
If you encounter the following error: Cannot read property 'openConfigFile' of undefined, you can manually create launch.json file in .vscode directory and paste the configuration from below.
Edit the launch.json that opens in the editor with:
{
    // Use IntelliSense to learn about possible attributes.
    // Hover to view descriptions of existing attributes.
    // For more information, visit: https://go.microsoft.com/fwlink/?linkid=830387
    "version": "0.2.0",
    "configurations": [
        {
            "name": "Python: Kedro Run",
            "type": "python",
            "request": "launch",
            "console": "integratedTerminal",
            "module": "kedro",
            "args": ["run"]
            // Any other arguments should be passed as a comma-seperated-list
            // e.g "args": ["run", "--pipeline", "pipeline_name"]
        }
    ]
}
To add a breakpoint in your pipeline.py script, for example, click on the left hand side of the line of code:
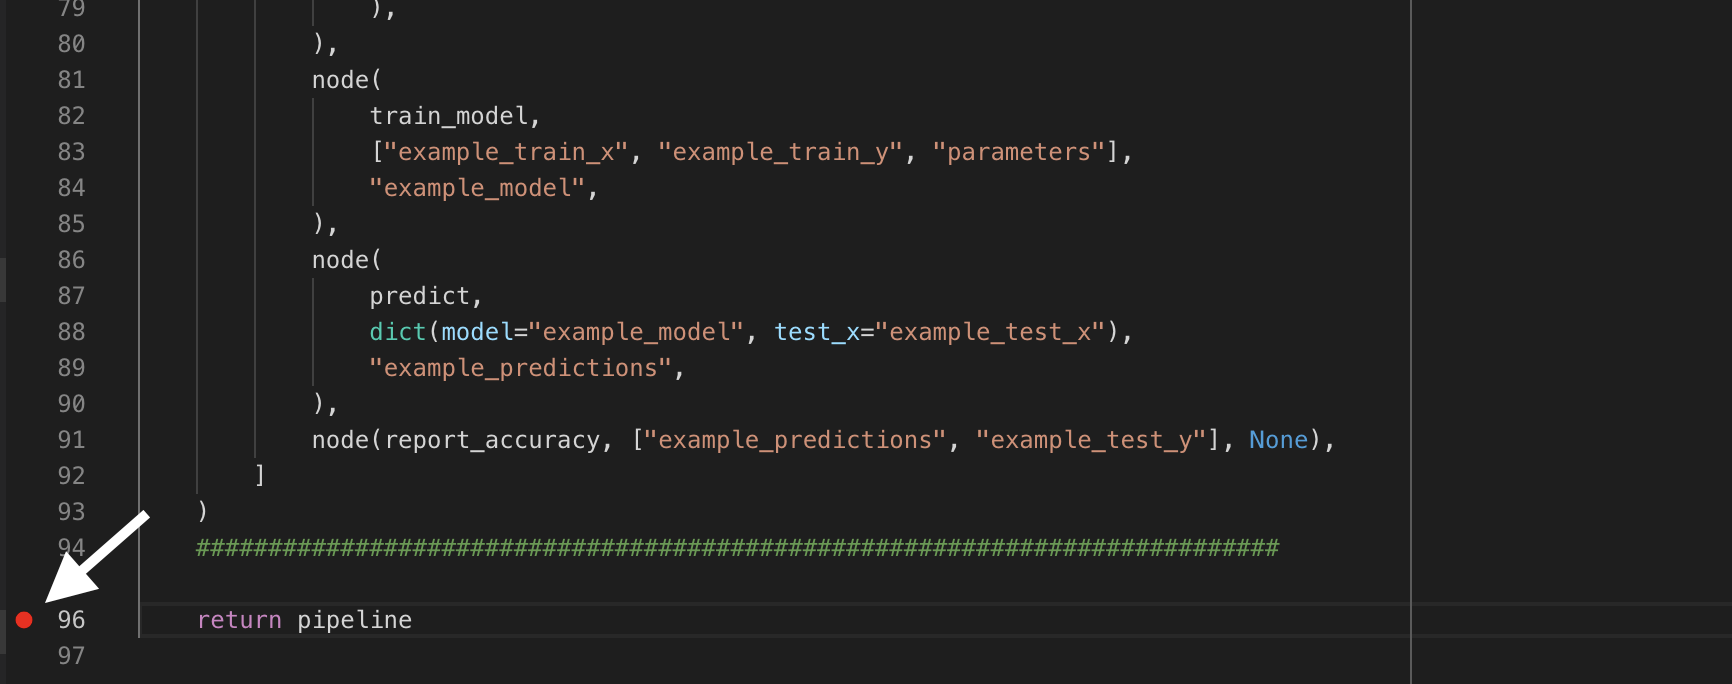
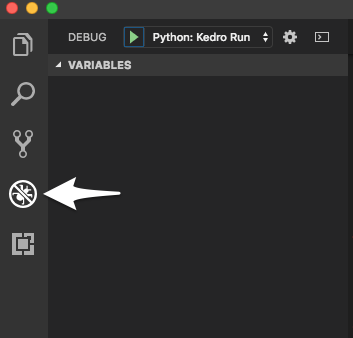
Click on Debug button on the left pane:
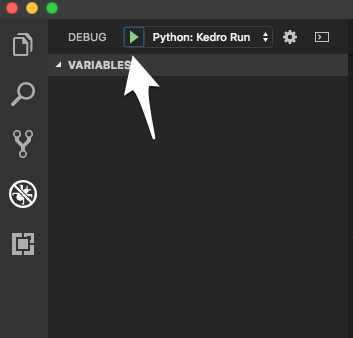
Then select the debug config Python: Kedro Run and click Debug (the green play button):
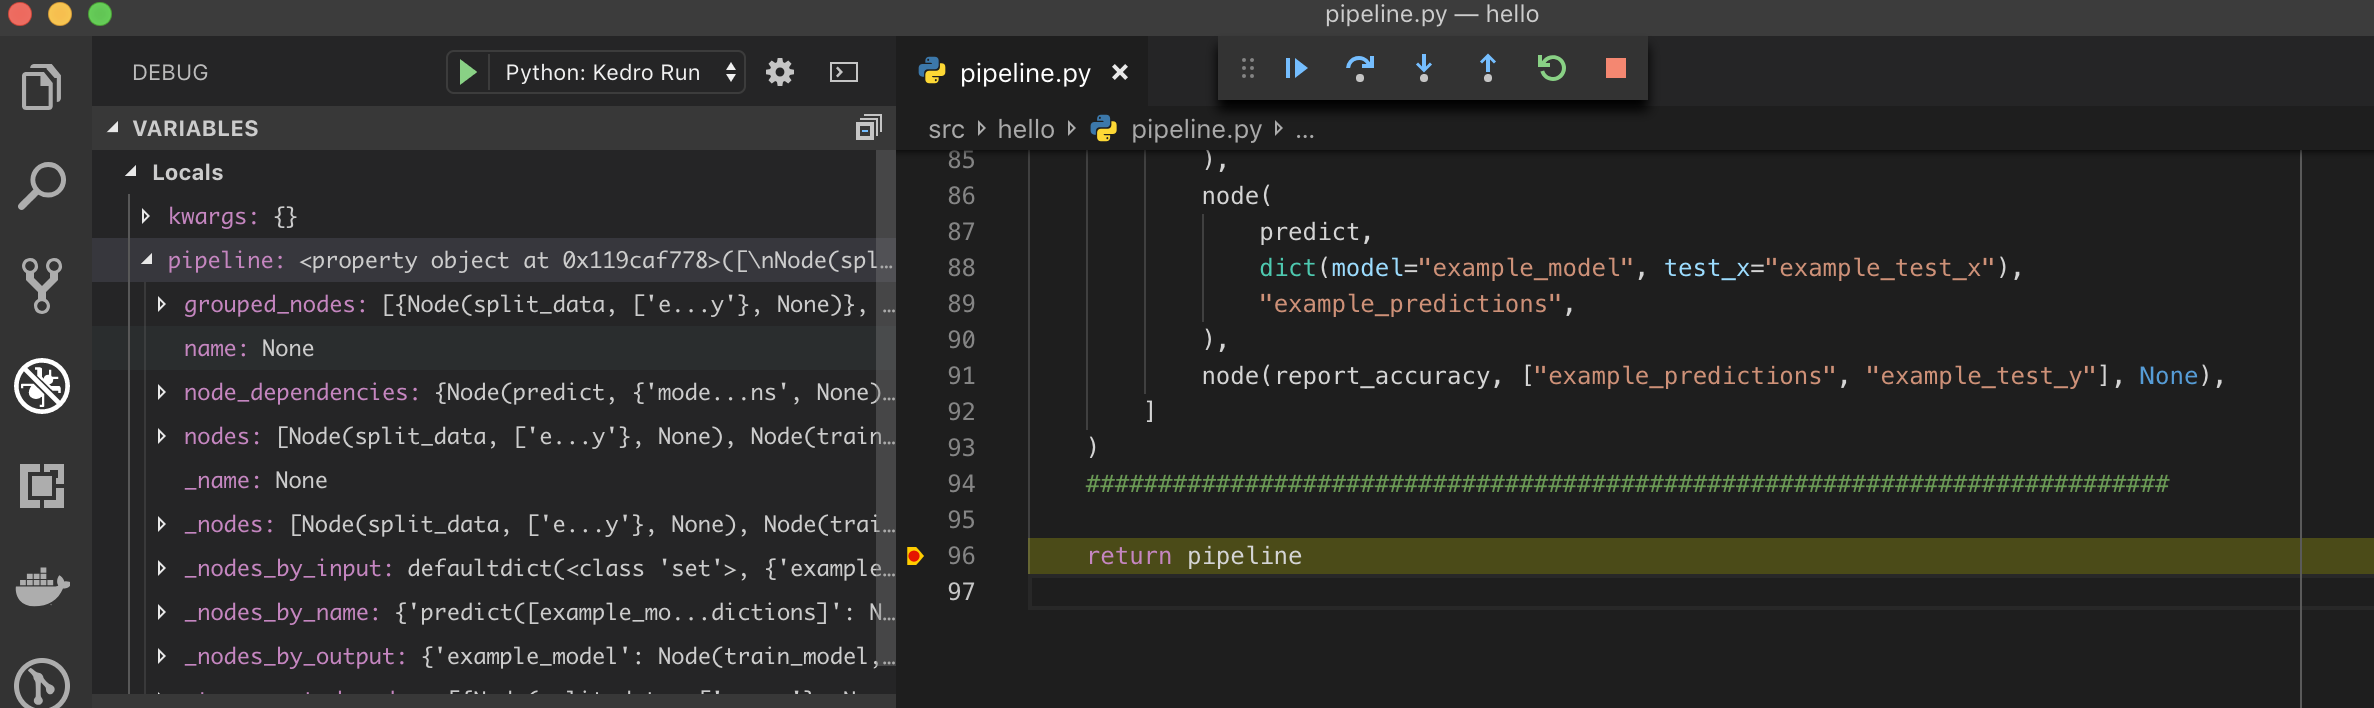
Execution should stop at the breakpoint:
Advanced: Remote interpreter debugging
It is possible to debug remotely using VS Code. The following example assumes SSH access is available on the remote computer (running a Unix-like OS) running the code that will be debugged.
First install the ptvsd Python library on both the local and remote computer using the following command (execute it on both computers in the appropriate conda environment):
python -m pip install --upgrade ptvsd
Go to the Debugger Configurations as described in the debugging section above. Add the following to the configurations array in launch.json:
{
    "name": "Kedro Remote Debugger",
    "type": "python",
    "request": "attach",
    "pathMappings": [
        {
            // You may also manually specify the directory containing your source code.
            "localRoot": "${workspaceFolder}",
            "remoteRoot": "/path/to/your/project"
        }
    ],
    "port": 3000,  // Set to the remote port.
    "host": "127.0.0.1"  // Set to your remote host's public IP address.
}
Change the remoteRoot path to the path of your project on the remote computer. Open the file src/<package_name>/__main__.py and enter the following near the top:
import ptvsd

# Allow other computers to attach to ptvsd at this IP address and port.
ptvsd.enable_attach(address=("127.0.0.1", 3000), redirect_output=True)

# Pause the program until a remote debugger is attached
print("Waiting for debugger to attach...")
ptvsd.wait_for_attach()
Ensure both computers (the computer you are working on and the remote computer executing your code) have the same source code. For example, you can use scp to sync your code:
scp -r <project_root> <your_username>@<remote_server>:projects/
❗The example above assumes there is a directory called projects in the home directory of the user account on the remote computer. This is where the project will be copied to. This can be set up as a deploy task as described above:
// Add to `tasks` array in `tasks.json`
{
    "label": "Deploy",
    "type": "shell",
    "command": "scp -r <project_root> <your_username>@<remote_server>:projects/",
}
Start executing the pipeline on your remote computer:
while :; do kedro run; done
You should see the following message in the terminal and execution will stop:
Waiting for debugger to attach...
Open a new terminal session and create an SSH tunnel from your local computer to the remote one (leave this process running):
ssh -vNL 3000:127.0.0.1:3000 <your_username>@<remote_server>
Go to the Debugging section in VS Code and select the newly created remote debugger profile:
You must set a breakpoint in VS Code as described in the debugging section above and start the debugger by clicking the green play triangle:
Configuring the Kedro catalog validation schema
You can enable the Kedro catalog validation schema in your VSCode IDE to enable real-time validation, autocompletion and see information about the different fields in your catalog as you write it. To enable this, make sure you have the YAML plugin installed.
Enter the following in your settings.json file:
{
  "yaml.schemas": {
    "https://raw.githubusercontent.com/kedro-org/kedro/develop/static/jsonschema/kedro-catalog-0.19.json": "conf/**/*catalog*"
  }
}
and start editing your catalog files.